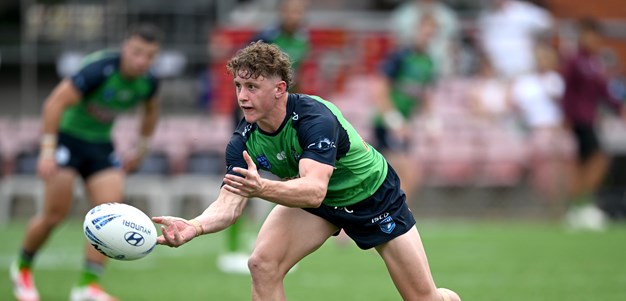

All the leading statistics from the Raiders v Rabbitohs match at GIO Stadium, including most tackles, runs and most creative players.
Metre Eaters:
1. Josh Papalii 141 Metres
2. Jarrad Kennedy 141 Metres
3. David Shillington 133 Metres
Top Tacklers:
1. Shaun Fensom 57 tackles
2. Glen Buttriss 35 tackles
3. Joel Edwards 32 tackles, Paul Vaughan 32 tackles
Most Creative:
1.Terry Campese 1 try assist and 1 line break assist
2. Josh McCrone 1 try assist
Second Phase Play:
1. Josh McCrone, Brett White, Shannon Boyd 2 offloads
2. David Shillington, Glen Buttriss, Josh Papalii, Joel Edwards, Shaun Fensom 1 offload
Damaging Runners:
1. Jarrad Kennedy 2 Line Breaks
2. Reece Bobinson, Sami Sauiluma, Josh Papalii 1 line break
Line Breaks:
The Raiders made five line breaks to the Rabbitohs 4
Kick Metres:
1. Josh McCrone 10 kicks for 204 metres
2. Terry Campese 3 kicks for 99 metres
3. Anthony Milford 1 kick for 19 metres
Possession Rate:
Canberra had 46% of possession to Souths 54%
Completion Rate:
The Raiders completed 21 out of 31 sets for a completion rate of 68%. Conversely, the Storm had a completion rate of 86%.
Penalties Conceded:
Penalties were level at 7-7
Errors:
The Raiders made 12 errors compared to 6 by South Sydney
Missed Tackles:
The Raiders missed 15 tackles compared to 22 by the Rabbitohs
Statistics courtesy of NRL Stats.


