You have skipped the navigation, tab for page content
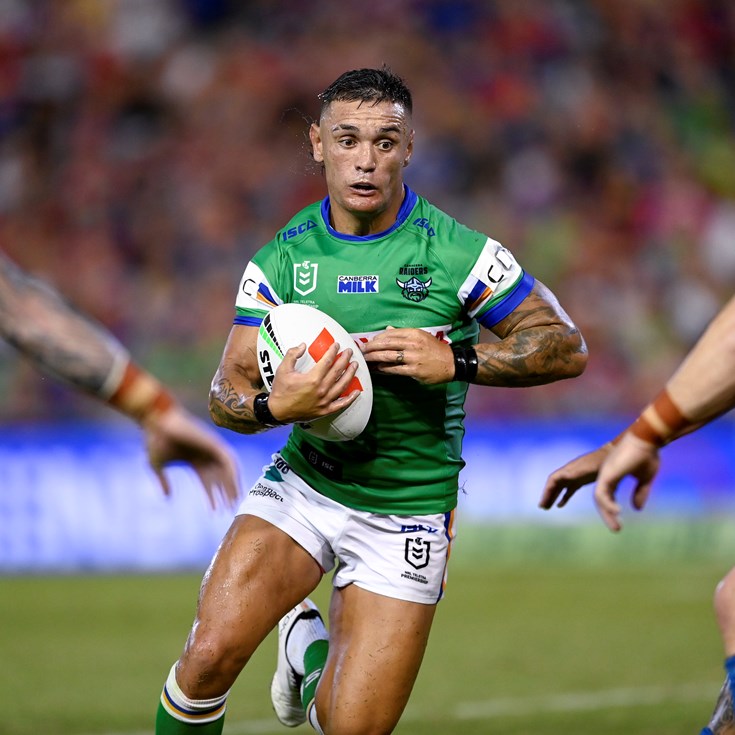
Danny Levi Profile Image

Danny Levi

Hooker

Raiders

Player Bio

Height:
177 cm
Date of Birth:
05 December 1995
Weight:
89 kg
Birthplace:
Wellington, NZ
Age:
28
Nickname:
-
Debut Club:
Newcastle Knights
Date:
21 June 2015
Opposition:
Cronulla-Sutherland Sharks
Round:
15
Previous Clubs:
Newcastle Knights, Manly-Warringah Sea Eagles, Brisbane Broncos
Junior Clubs:
Randwick Kingfishers, Glenmore Park Brumbies
Biography:

Danny Levi joined the Raiders for the 2023 season and instantly made his presence known, debuting for the club in Round One against the Cowboys.

Levi unfortunately suffered a fractured jaw in the clubs' first home game against the Sharks in Round Three. Levi became an integral part of the clubs' NSW Cup side, who finished fourth and made it to week two of the finals series.

Career

Appearances
138
Tries
13

2024 Season

Appearances
22

Scoring

Tries
6

Kicking

Forced Drop Outs
0
Average Kicking Metres
2.6

Attack

Try Assists
2
Line Break Assists
2

Passing

Offloads
6
Receipts
1333

Defence

Tackles Made
507
Tackle Efficiency

Running Metres

Average Running Metres
25
Total Running Metres
556

Fantasy

Total Points
517
Average Points
23.5

2024 Season - By Round

Round Opponent Score Position Minutes Played Tries Goals 1 Point Field Goals 2 Point Field Goals Points Kicking Metres Try Assists Linebreaks Tackle Breaks Post Contact Metres Offloads Receipts Tackles Made Missed Tackles Total Running Metres Hit Up Running Metres Kick Return Metres
1 Knights Won 12 - 28 Hooker 56 1 - - - 4 12 - 1 2 8 - 92 21 2 40 7 -
2 Wests Tigers Won 32 - 12 Hooker 58 1 - - - 4 - - - - 2 1 79 21 5 36 - -
3 Warriors Lost 18 - 10 Hooker 52 - - - - - - - - - 7 - 90 29 3 38 - -
4 Sharks Lost 36 - 22 Hooker 63 1 - - - 4 - - 1 2 13 1 85 28 3 43 - -
5 Eels Won 41 - 8 Hooker 62 1 - - - 4 - - - - 5 - 90 27 3 22 - -
6 Titans Won 21 - 20 Hooker 57 - - - - - - - - - 7 - 96 25 4 37 - -
7 Broncos Lost 34 - 10 Hooker 75 - - - - - 40 - - - 2 1 105 37 5 20 3 -
8 Sharks Lost 0 - 40 Hooker 40 - - - - - - - - - 5 - 60 25 4 12 - -
9 Sea Eagles Won 24 - 26 Hooker 53 - - - - - - - - - - - 68 32 2 7 - -
11 Bulldogs Won 24 - 20 Hooker 50 - - - - - - - - - 6 1 59 24 6 23 - -
12 Roosters Lost 16 - 44 Hooker 49 - - - - - - 1 - - - - 65 25 5 - - -
13 Dolphins Won 25 - 26 Hooker 47 - - - - - - - - - 10 - 61 30 1 33 - -
15 Cowboys Lost 16 - 34 Hooker 58 - - - - - - - - - 16 1 67 29 - 34 - -
16 Wests Tigers Lost 48 - 24 Interchange 47 1 - - - 4 - - 1 2 10 - 51 19 3 21 3 -
17 Storm Lost 16 - 6 Interchange 19 - - - - - - - - - 2 - 24 12 2 7 - -
18 Knights Lost 12 - 16 Interchange 25 - - - - - - - - - 6 - 40 18 - 8 - -
20 Warriors Won 20 - 18 Interchange - - - - - - - - - - - - - - - - - -
21 Rabbitohs Won 32 - 12 Interchange 20 - - - - - 7 - 1 - 4 - 29 12 2 30 - -
22 Bulldogs Lost 22 - 18 Interchange 17 - - - - - - - - - 2 1 29 10 1 14 - -
24 Cowboys Lost 42 - 4 Interchange 19 - - - - - - - - - 1 - 32 10 1 11 - -
25 Panthers Won 22 - 18 Hooker 32 - - - - - - - - - 4 - 25 13 4 19 - -
26 Roosters Won 12 - 14 Hooker 45 - - - - - - 1 - - 14 - 60 33 1 40 - -
27 Dragons Won 24 - 26 Hooker 36 1 - - - 4 - - - 1 16 - 26 27 4 53 - -

Career By Season

Career By Season
Year Played Won Lost Drawn Win % Tries Goals 1 Point Field Goals 2 Point Field Goals Points Kicking Metres Kicking Metres Average Goal Conversion Rate Forced Drop Outs Try Assists Offloads Receipts Tackles Made Missed Tackles Tackle Efficiency Total Running Metres Average Running Metres Kick Return Metres Total Points Average Points
Knights 2015 7 1 6 - 14% 2 - - - 8 36 5.17 - - - 1 330 131 10 92.91% 186 26.00 - 161 23.0
Knights 2016 18 - 17 1 - - - - - - 88 4.91 - 3 - 1 1,163 510 55 87.11% 629 34.00 - 442 24.6
Knights 2017 24 5 19 - 21% 3 - - - 12 83 3.48 - 2 4 4 1,830 771 55 93.34% 1,131 47.00 - 843 35.1
Knights 2018 17 5 12 - 29% - - - - - - - - - 5 6 1,316 535 30 94.69% 630 37.00 - 561 33.0
Knights 2019 17 6 11 - 35% - - - - - 8 0.48 - - 2 3 1,368 582 43 93.12% 831 48.00 - 619 36.4
Sea Eagles 2020 20 7 13 - 35% 2 - - - 8 115 5.77 - - 2 14 1,721 666 47 93.41% 789 39.00 - 702 35.1
Broncos 2021 9 3 6 - 33% - - - - - - - - - 2 2 450 203 19 91.44% 344 38.00 - 237 26.3
Raiders 2023 4 1 3 - 25% - - - - - 4 0.95 - - 1 2 146 78 7 91.76% 84 21.00 - 83 20.8
Raiders 2024 22 11 11 - 50% 6 - - - 24 58 2.65 - - 2 6 1,333 507 61 89.26% 556 25.00 - 517 23.5

Career Overall

Career Overall
Year Start Year End Played Won Lost Drawn Win % Tries Goals 1 Point Field Goals 2 Point Field Goals Points Kicking Metres Kicking Metres Average Goal Conversion Rate Forced Drop Outs Try Assists Offloads Receipts Tackles Made Missed Tackles Tackle Efficiency Total Running Metres Average Running Metres Kick Return Metres Total Points Average Points
Knights 2015 2019 83 17 65 1 20% 5 - - - 20 216 2.60 - 5 11 15 6,007 2,529 193 92.91% 3,409 41.00 - 2,627 31.6
Sea Eagles 2020 2020 20 7 13 - 35% 2 - - - 8 115 5.77 - - 2 14 1,721 666 47 93.41% 789 39.00 - 702 35.1
Broncos 2021 2021 9 3 6 - 33% - - - - - - - - - 2 2 450 203 19 91.44% 344 38.00 - 237 26.3
Raiders 2023 2024 26 12 14 - 46% 6 - - - 24 62 2.30 - - 3 8 1,479 585 68 89.59% 641 23.00 - 600 23.1

Latest

Team Mates

Acknowledgement of Country

Canberra Raiders respect and honour the Traditional Custodians of the land and pay our respects to their Elders past, present and future. We acknowledge the stories, traditions and living cultures of Aboriginal and Torres Strait Islander peoples on the lands we meet, gather and play on.